Market Updates

Action Replay: Summer Correction, Autumn Rally?
 Davy Asset Management
Dublin, Ireland
FOR FINANCIAL ADVISORS ONLY
Background
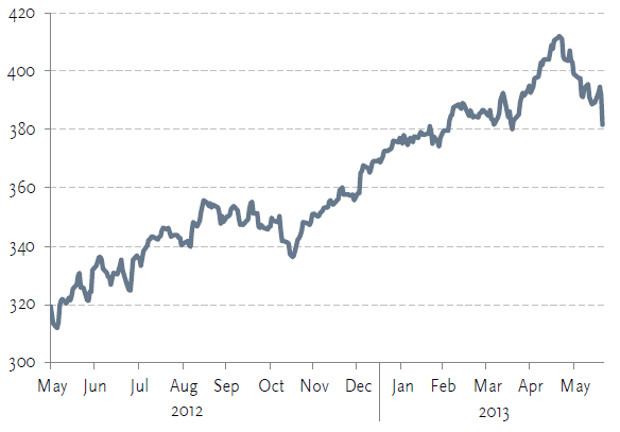
Just like last year, within a few weeks of issuing my longer-term positive forecasts, equity markets stalled and slid backwards. So far, global equity markets are down some 8% since the late-May peak, with Japan and Emerging Markets down 17% and 11% respectively.
Figure 1: MSCI All Country World Index, May 2012-June 2013
Source: Bloomberg
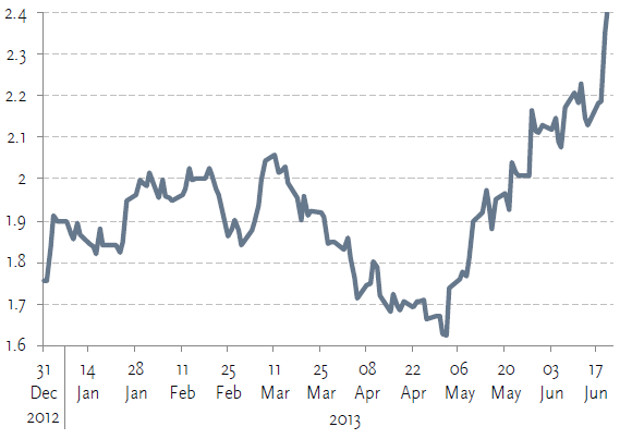
Rising bond yields and the recent US Fed statement about reducing quantitative easing (‘QE’) are generally cited as the main factors behind this sell-off. The US 10-year bond yield has risen sharply in recent weeks, as investors exit in a panic.
Figure 2: 10-Year Government Bond Yields, December 2012-June 2013
Source: Bloomberg
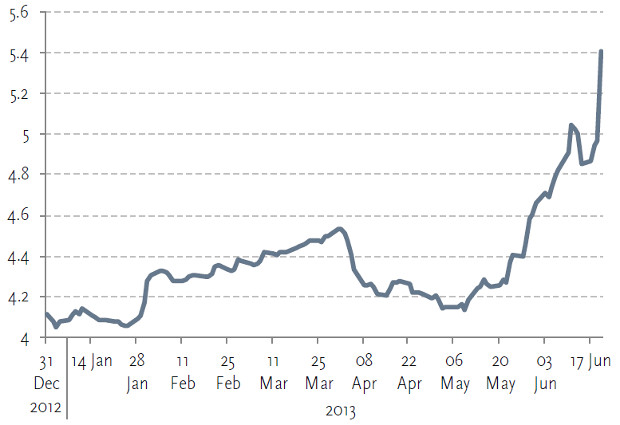
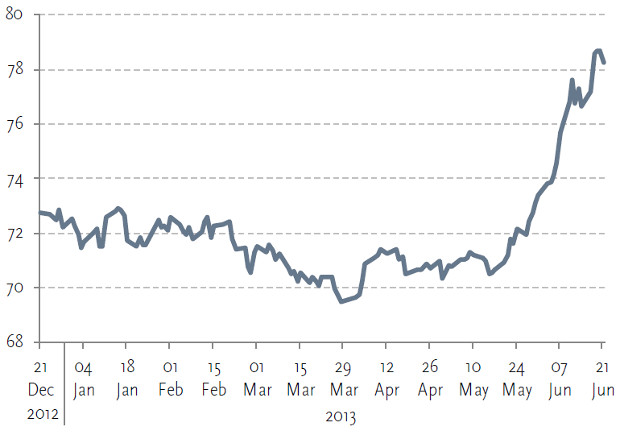
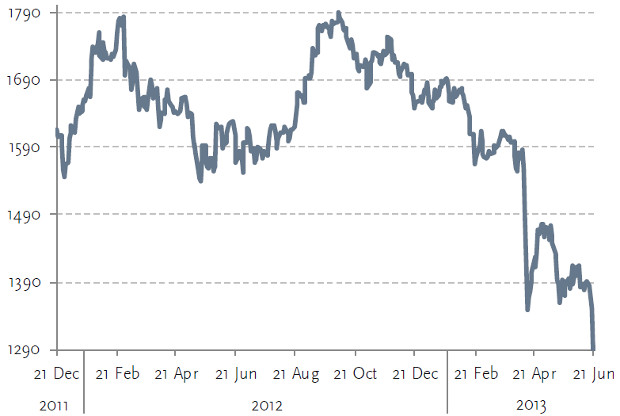
Regular readers know that we have long-thought that bond yields were too low, and that equities have offered better upside potential. Highly-rated sovereign bond yields are still relatively low, and we believe they can rise further. Other asset classes which some investors thought had become relatively ‘safe’ have also fallen in value significantly in recent weeks, such as Emerging Market Bonds, Emerging Market Currencies and Gold: see Figures 3-5.
Figure 3: Emerging Market Bond Yields, December 2012-June 2013
Source: Bloomberg
Figure 4: Indian rupee versus euros, December 2012-June 2013
Source: Bloomberg
Figure 5: Gold, December 2011-June 2013
Source: Bloomberg
We expect this corrective phase may continue over the summer months. From a longer-term viewpoint, we believe this consolidation phase is a healthy development as it will bring back a heightened sense of risk and remove the investor complacency that had built up in the spring – both of which are essential to keep the bull market going.
Davy Asset Management Outlook
The underlying positive fundamental frameworkof global equity markets that has driven our medium-term positive view has not changed, despite the recent and on-going correction. Our fundamental positive thesis for equities remains firmly in place. Recent statements by the US Fed on tapering and ending QE have unsettled financial markets but will, in our opinion, only occur if the Fed is convinced that sustainable economic growth has returned, and that is positive in the longer-term for equities. This backdrop is more positive for developed markets, and in our view for the first time in many years, developed market growth prospects look healthier than their Emerging Market counterparts – this suits the bias of the Davy funds which are overweight the US and Europe versus Emerging Markets.
The Fed’s statements also reinforce our negative view on highly-rated sovereign and corporate bonds, and we believe bond yields will continue to rise. Rising yields are also another indication that the US economy is improving and ‘normalising’, although it is one of the reasons for the current equity market correction.
On the other hand, continued economic weakness in Europe suggests that interest/deposit rates will remain very low. Rollover deposit rates continue to face downward pressure.
Recent Correction
By the end of May 2013, the US S&P 500 Index was up 24% since the summer 2012 lows. Given this strong return, we believe the market had gotten ahead of itself given the modest economic performance in the US and weakening global growth outlook on the back of Emerging Market and European issues. However, on a longer-term outlook we believe equity markets are in the midst of a multi-year multiple expansion very similar to that of the mid-1980s and mid-1990s. While that does not guarantee the similarities will continue, we believe investors are far too focused on short-term negative issues versus the simple medium-term direction of fundamental change and valuation trend, which remains positive.
The longer-term positive thesis remains intact, driven by the following:
- Inflation remains low.
- Interest rates, albeit potentially starting to rise in 2014, remain very low.
- Companies have strong financial positions.
- The US economy is in a positive trajectory (hence the rationale for tapering).
- EPS estimates are trending higher.
- The potential move from bonds to equities has not yet commenced in a significant way.
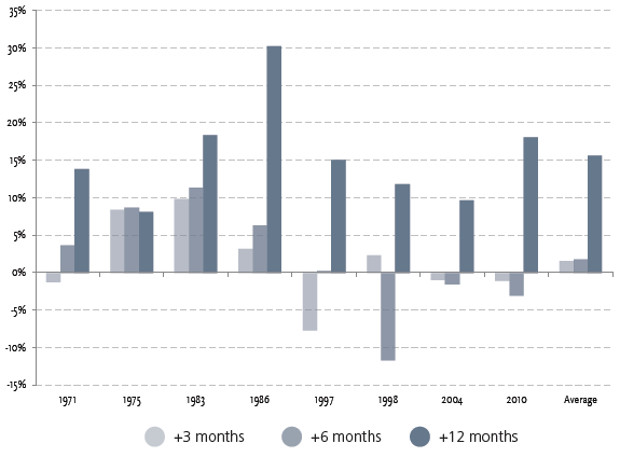
In order to assess how equity markets behave after strong rallies such as the one we have just experienced, our colleagues in J&E Davy examined the history of the last 40 years for similar periods of market resilience. There were eight other occasions over that period when equities have experienced similarly strong momentum over a 12-month period (1971, 1975, 1983, 1986, 1997, 1998, 2004 and 2010). While each period had its own specific nuances, analysing what happened after the momentum peaked during those bull markets yielded some interesting results.
Figure 6: How do markets perform after strong rallies?
MSCI World Total Return after momentum peaks: +3, +6 and +12 months, in %
Source: MSCI, Davy
Note: Data used in this chart is from 1970-2013. ‘Average’ equals the simple average of the eight periods identified with similarly strong momentum to today since 1970.
As Figure 6 illustrates, although returns tended to be mixed in the three to six months after momentum peaked, looking out over 12 months, global equity markets increased over 15% on average, (and returns were positive in every single period on a one-year time horizon).
This suggests that putting money into equities after a strong rally has not necessarily led to poor returns for those with a sufficiently long enough time horizon.
Conclusion
We believe the current volatility in equity markets will be short-lived, and that positive fundamentals will re-assert themselves and allow equity markets to regain positive momentum. In our view, bonds remain unattractive, euro deposit rates will remain very low, and investors have been given another opportunity to invest in equities at attractive prices.
Please click here for additional Market Data and important information
CONTACT THE TEAM
For more information, call or email us to discuss your requirements or arrange a meeting.