Insights

Investing Insights October 2016
Davy Defensive Equity Income Fund 5-Year Anniversary
 Mark Seavers
Chief Investment Officer
 Davan Byrne
Associate Fund Manager
INVESTMENT PROFESSIONALS ONLY
On 30th September 30th 2016, the Davy Defensive Equity Income Fund (the Fund) marked its fifth anniversary, a significant milestone.The Fund has provided downside protection with an impressive return of 52.7% over the past five years. The strong performance can be attributed to diligent and prudent management as well as a consistent application of our investment philosophy and process.
Context is key
It is important to remember the context in which the Fund was established in September 2011. Europe was in the throes of a sovereign debt crisis that was roiling not just European, but global markets. The Eurostoxx 50 Index had fallen -35% from its February 2011 high, the S&P 500 (-17.9%) and MSCI World Index (-20.6%) were feeling similar pressures. There was much fear and anxiety among investors as words like ‘contagion’, ‘financial meltdown’ and ‘Grexit’ were dominating headlines.
The Fund was established under three guiding principles which remain in place today:
1.To invest in high-quality and dividend paying companies.
2.To reduce the level of volatility within the Fund (add protection).
3.To maintain equity market exposure.
Two lines of defence
To achieve the Fund’s objectives, we employ two lines of defence. The first is the underlying equity book, which is defensive in nature and invests in high-quality, global, large-cap, dividend-paying companies with strong balance sheets, good capital discipline and healthy cash flows.
The second line of defence is the protection strategy which has two parts:
- The Fund sells call options on some of the stocks held within the Fund to generate premium. Essentially selling some of the potential upside in the equity portfolio in return for an immediate payment.
- The Fund uses the payment generated from selling call options to buy puts on the S&P 500 and Eurostoxx 50 indices so that if markets fall, the put options rise in value cushioning some of the capital loss for investors.
True to the objectives of the Fund, investors have benefited not just from strong equity market returns but have also enjoyed a lower level of volatility than the broader equity market. In the five years since inception, the annualised volatility of the Fund has been 10.6% versus 14.7% for the Fund’s benchmark, the MSCI World Index.
Five years on
A lot has changed in the five years since the Fund was launched. Equity markets are considerably higher: the S&P 500 has gained over 95% from the 2011 lows; the MSCI World Index has advanced by over 115%; and Eurostoxx 50 Index has risen by 50%. Bond yields have lowered globally as many central banks have targeted the price of money through zero interest rates, quantitative easing, and negative interest rates. The threat of Grexit has been superseded by the reality of an impending Brexit.
What remains the same, however, is the anxiety that uncharted waters create in investors’ minds. Back in 2011, the pressure on Eurozone bond markets was unprecedented. Today, it is the valuation of those bonds that confounds many. Volatility can disappear for extended periods before returning with a vengeance.
The value of protection
Over the past five years, markets have generally trended upwards and the Fund has had few opportunities to show its mettle when it mattered. Since July 2015, however, volatility has picked up and the real value of downside protection has been evident. Figures 1 - 3 below illustrate three specific instances in which the markets have experienced drawdowns and how the Fund performed during these volatile periods.
1. August 2015 - Chinese yuan devaluation
Markets experienced a sharp drawdown following the unexpected devaluation of the Chinese yuan by the Peoples’ Bank of China. At the trough, the Fund outperformed the market by 4.1% with the MSCI World Index down 13.9%, the Fund was down 9.8%.
Figure 1: August 2015 - Chinese yuan devaluation
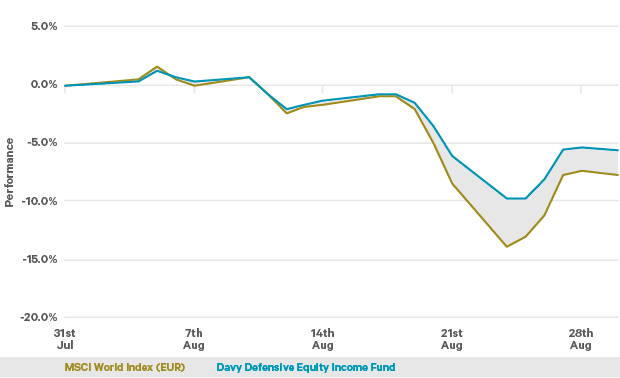 Source: Davy Asset Management and Bloombery 31st July to 31st August 2015
2. September 2015 – Federal Reserve (Fed) does not raise rates
Markets wobble following the Fed’s decision to keep rates on hold. At the trough the Fund outperformed the market by 3.5% with the MSCI World Index down 5.5% and the Fund down only 2.0%.
Figure 2: September 2015 - Fed does not raise rates
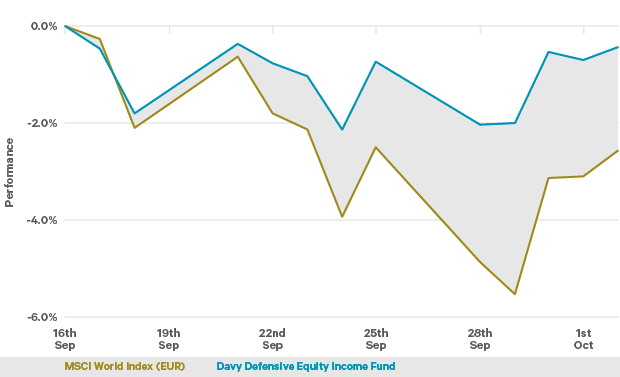 Source: Davy Asset Management and Bloomberg from 16th September to 2nd October 2015
3. 1st Quarter 2016 – Markets sell off
Equity markets sold off at the beginning of this year as investors worried about banks’ solvency, falling energy and commodities prices, the effects of the strong dollar, capital flight from China and the trajectory of US interest rates. This culminated in the worst start to a year in the S&P 500’s history. During this period, the Fund, true to its name, outperformed the benchmark by 6.2% peak-to-trough, with the MSCI World Index down 15.3% and the Fund down 9.1%.
Figure 3: Q1st Quarter 2016 - Markets sell off
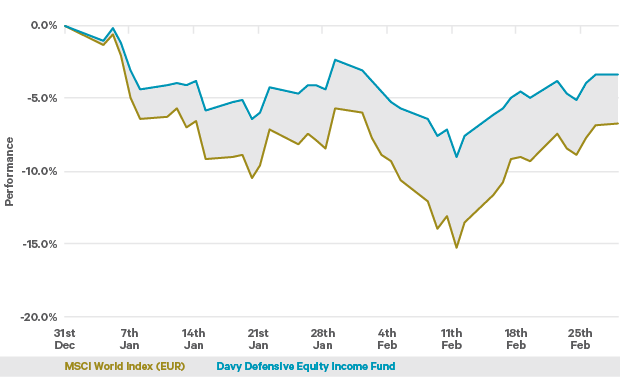 Source: Davy Asset Management and Bloomberg from 31st December 2015 to 29th February 2016
On all three occasions, the Fund illustrates its ability to retain market exposure as equities rally maintaining its outperformance. As a result of the underlying investment strategy, the Fund does not time when to be in and out of the market, removing any market timing risk. The Fund will always remain invested in equity markets and have protection in place regardless of our investment outlook.
Looking ahead
Given that equity markets are not cheap, and the uncertainty surrounding the global economy, we see plenty of potential catalysts for further market volatility. These include eventual Brexit fallout, the US presidential election, the Fed's rate tightening cycle; a slew of upcoming referendums in Europe and China's economic transition.
For more information on the Davy Defensive Equity Income Fund, please contact our Relationship Management & Distribution Team .
This report does not constitute an offer for the purchase or sale of any financial instrument, trading strategy, product or service. No one receiving this report should treat any of its contents as constituting advice or a personal recommendation. It does not take into account the investment objectives or financial situation of any particular person. All investments involve a degree of risk. Equities may involve a high degree of risk and may not be suitable for all investors. Funds can vary greatly and investors should examine carefully the fund’s structure, investment objective, fees and risks prior to any investment decision. There are different reasons why an investor would choose to invest in a particular asset class or fund and each investor must consider the inherent risks therein based on his/her own personal circumstances. Neither past experience nor the current situation are necessarily accurate guides to the future.
Warning: Past performance is not a reliable guide to future performance.
MSCI Inc. (MSCI). Without prior written permission of MSCI, this information and any other MSCI intellectual property may not be reproduced, disseminated or used to create any financial products, including any indices. This information is provided on an ‘as is’ basis. The user assumes the entire risk of any use made of this information. MSCI, its affiliates and any third party involved in, or related to, computing or compiling the information hereby expressly disclaim all warranties of originality, accuracy, completeness, merchantability or fitness for a particular purpose with respect to any of this information. Without limiting any of the foregoing, in no event shall MSCI, any of its affiliates or any third party involved in, or related to, computing or compiling the information have any liability for any damages of any kind. MSCI and the MSCI indexes are services marks of MSCI and its affiliates.
Please click here for Market Data and other important information
“SPDR” is a registered trademark of Standard & Poor’s Financial Services LLC (“S&P”) and has been licensed for use by State Street Corporation. STANDARD & POOR’S, S&P, S&P 500 and S&P MIDCAP 400 are registered trademarks of Standard & Poor’s Financial Services LLC. No financial product offered by State Street Corporation or its affiliates is sponsored, endorsed, sold or promoted by S&P or its Affiliates, and S&P and its affiliates make no representation, warranty or condition regarding the advisability of buying, selling or holding units/shares in such products. Further limitations and important information that could affect investors’ rights are described in the prospectus for the applicable product.
To read more Insights click here