Insights

Market Update April 2016
Growth in a Low-Growth Environment
 Chantal A. Brennan
Research Director
 Jeremy Humphries
Fund Manager
FOR INVESTMENT PROFESSIONALS ONLY
Small and mid-cap companies
The outperformance of small and mid-cap (SMID) stocks relative to their large-cap peers is a much debated anomaly but the evidence is clear over the long term. SMID stocks have outperformed large caps by an impressive by 114% since 2000. The current environment continues to be supportive of the small and mid-cap space and year-to-date the MSCI SMID Index has outperformed the MSCI World Index by about 1.4%.
Despite the headwinds, we believe the current market environment remains favourable for SMID companies. When we look at the SMID space, we can see that both historic and forward 12-month sales growth rates of SMID companies are higher than those of their large-cap peers (see Figure 1). Furthermore, top-line revenues of SMIDs are expected to grow at more than double that of larger companies.
Drilling down we are experiencing weaker top line growth within the large-cap space (particularly evident in Western Europe and Japan) despite their negative interest rate policies (see Appendix). The top-line growth of some of the more thematic sectors such as Healthcare is expected to contract next year. While companies in this space struggle to grow revenues organically, one available option is to grow via acquisition of smaller companies. Over the last 24 months, we have observed a significant increase in the number of M&A deals (completed, pending and proposed) with on average premium of c.30% paid.
Figure 1: Historic and forecast benchmark sales growth*
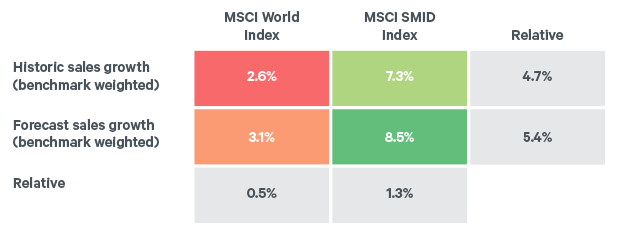
*Based on “Bloomberg Estimates Sales”, estimates reflect a company’s net revenues or sales from continuing operations
Note: Historic and forecast sector and regional sales growth figure in the Appendix
Source: Davy Asset Management, MSCI, Bloomberg as at 31st March 2016
In the remainder of this article we consider a number of encouraging aspects for SMID companies given markets conditions. We assess the size of the Initial Public Offering (IPO) market, current and historical valuations and the level of merger & acquisition (M&A) activity.
The IPO Market
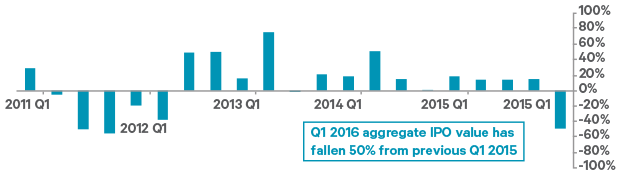
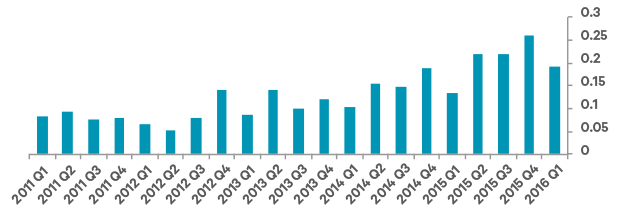
The IPO market stalled during the first quarter of the year, due to the increase in market volatility, contracting by approximately 50% in both the number and value of IPO deals compared to the first quarter of 2015. The decrease in the number of IPOs is broadly favourable for smaller companies as it means the market has less breadth, which increases competition from larger companies.
Figure 2: Quarterly global value of IPOs from 2011 to 2015. Year-on-Year Change in Quarterly IPO Value
Source: Davy Asset Management, MSCI, Bloomberg as at 31st March 2016
Valuation
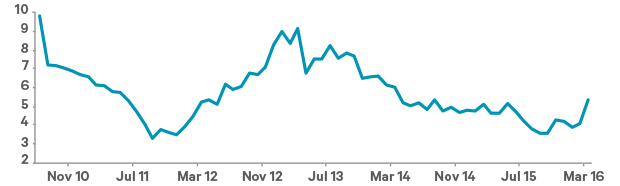
While small and mid-cap companies have historically traded at a premium to larger companies, the spread between the two has steadily narrowed since March 2013, reaching a low towards end of 2015. The sell-off in the markets at the start of the year has presented the perfect opportunity for bargain hunting by larger companies. In March, we have started to see the valuation spread on smaller companies begin to widen again.
Figure 3: Relative valuation of MSCI World SMID Index versus MSCI World Index, 2010 to 2015. P/E Spread MSCI SMID vs MSCI World
Source: Davy Asset Management, MSCI, Bloomberg as at 31st March 2016
Merger & Acquisition Activity (M&A)
With unprecedented large cash piles now sitting on the balance sheets of many large companies and the dimmed growth prospects they face, these companies are continuing to deploy capital to acquire top-line growth.
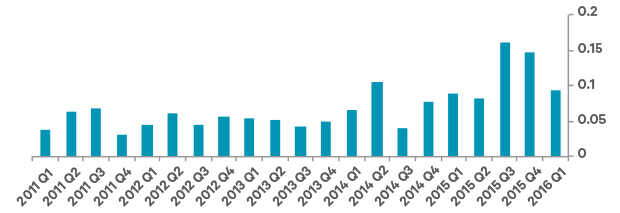
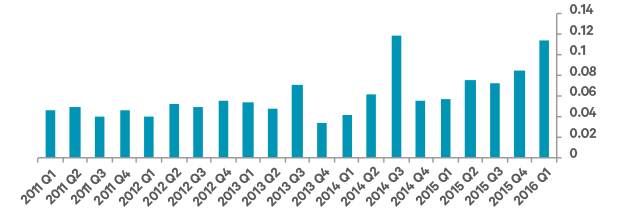
In the sectors where SMID companies are relatively more concentrated, we are seeing a continued increase in global M&A deal activity. As with the IPO market, while the number of completed M&A deals in 2016 has declined, overall appetite, including pending and proposed deals, continues to increase year-on-year.
Figure 4: M&A Transaction Volume ($tn), 2011 to 2016
Industrials
Source: Davy Asset Management and Bloomberg as at 31st March 2016
Financials
Source: Davy Asset Management and Bloomberg as at 31st March 2016
Consumer Discretionary
 Source: Davy Asset Management and Bloomberg as at 31st March 2016
Conclusion
Market volatility in 2016 is creating some interesting opportunities, especially within the SMID equity space, where we believe there is greater opportunity for growth. An unusual feature of 2016 to date has been the relative outperformance of small and mid-cap stocks as large caps generally outperform during weak markets. Historically, this has been justified by large-caps’ greater exposure to emerging markets, whereas SMIDs tend to have greater exposure to their domestic economies. The difference this time we believe is supported by their higher growth prospects, relatively undiminished global M&A activity and attractive valuations. The MSCI World Index (TR in Eur) fell -5.0% in Q1 2016 underperforming the MSCI World SMID Index (TR in Eur) by 1.4%. In comparison the Davy Discovery Fund outperformed the MSCI World Index and MSCI World SMID Index by 3.5% and 2.1% respectively in Q1 2016.
The Davy Discovery Fund is well positioned to benefit from the higher growth prospects and M&A activity within the small and mid-cap environment. The fund invests in SMID equities that offer greater growth potential as their businesses continue to develop from less-established entities into more mature companies.
Historically, the Fund has benefitted from M&A activity as a number of the holdings have been acquired by their large cap peers. While it’s important to note that the fund does not try to identify stocks which are likely to participate in M&A activity, the metrics used by the fund manager for screening includes several used by professionals operating in the M&A environment.
Appendix
Figure A.1 Historic and forecast sector and regional sales growth figure below**
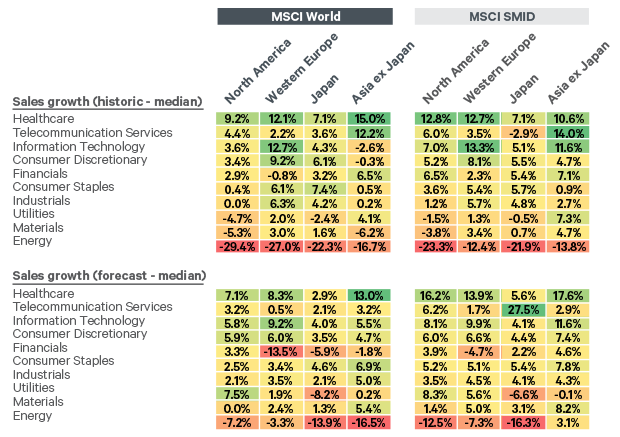
**Based on “Bloomberg Estimates Sales”, estimates reflect a company’s net revenues or sales from continuing operations
Source: Davy Asset Management, MSCI, Bloomberg as at 31st March 2016
Warning: Past performance is not a reliable guide to future performance. Some figures are forecasts, which are only estimates. They should not be relied upon to make investment decisions.
Please click here for Market Data and additional important information.
To read more Insights, click here