Insights

Investing Insights November 2019
Quality Matters - More than the sum of its parts
 Jeremy Humphries
Fund Manager
Quantitative Analyst
In this research note, we demonstrate that Davy Asset Management’s (DAM) definition of Quality (QUALITY) provides a positive asymmetric return profile, over and above that of any of its four sub-pillars i.e. Profitability, Persistence, Protection and People.
Analysis
DAM QUALITY, as detailed in our previous working series, is represented by a custom index, the DAM QUALITY Index, the construction of which follows a similar methodology to that of the MSCI World Quality Index1. The DAM QUALITY Index is calculated as the top quintile of the MSCI World Index, ranked according to the DAM QUALITY score and then market-cap weighted2.
A similar approach is used to create indices for each of the four sub-pillars whereby the individual pillar indices are constructed as the top quintile of the MSCI World Index and ranked by the respective pillar scores. This allows us to analyse the effect of each individual pillar.
Pillar analysis is undertaken using data observed from our live model, which has been in place at DAM since 20163. This proprietary model is based on 15 years of back-tested data, and follows DAM’s Quality Philosophy which was established in 2014. For each pillar, we assess the return profile and up/down market capture rates and compare versus the overall DAM QUALITY model.
"The whole is greater than the sum of its parts." Aristotle
Looking at the differential between return captures in Up and Down markets, we can see that QUALITY and three of the four pillars – Profitability, Protection and People – deliver positive asymmetric returns, as seen in Figure 1. Although Persistence does not deliver positive asymmetric returns, it compensates with an above average return in Up markets. Given QUALITY generates the strongest asymmetric return profile with an Up and Down capture of 104% and 91% respectively, this leads us to believe that QUALITY is in fact more than the sum of its individual pillars.
Figure 1: Average monthly return capture of QUALITY and pillar performance relative to MSCI World Index (February 2016 to July 2019)
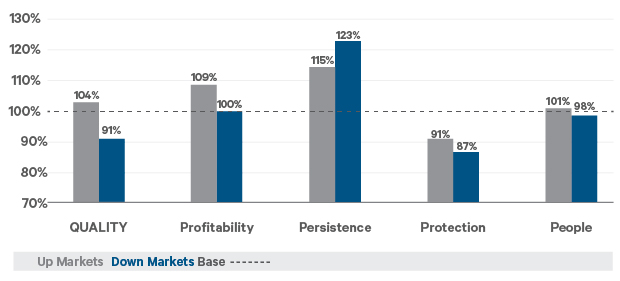
Source: Davy Asset Management, MSCI, and Bloomberg as at 31st July 2019, in USD. The benchmark used is the MSCI World Index.
Examining the results of the analysis, Table 1 shows the favourable return capture profile for QUALITY, when compared to the sub-pillars. QUALITY captures 104% of the MSCI World Index (benchmark) return in Up markets but captures only 91% of the return in a downturn. Indeed, some of the other pillars, such as Profitability and Persistence, have a higher return capture in Up markets, but they also have a significantly higher return capture in Down markets.
Table 1: Up and Down performance of QUALITY and its pillars (February 2016 to July 2019)
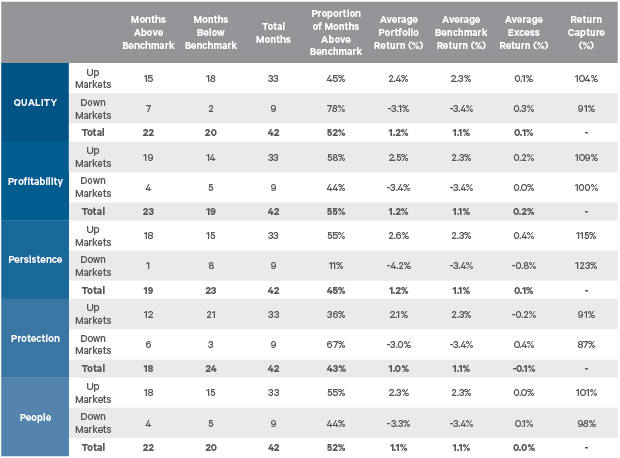
Source: Davy Asset Management, MSCI, and Bloomberg as at 31st July 2019, in USD. The benchmark used is the MSCI World Index.
In our latest insight, we take a deeper dive into the four individual sub-pillars making up the DAM QUALITY model: Profitability, Persistence, Protection, and People. We believe that these four pillars are essential to achieving better positive asymmetric returns. We find that while three of the four sub-pillars of QUALITY provide asymmetric returns, none do so to the same extent as QUALITY, highlighting that QUALITY is more than the sum of its parts.
For more information on DAM QUALITY and a Pdf of this insight click here. If you are interested in learning more about our strategies, please contact a member of our team http://www.davyassetmanagement.com/contact
Please click here for Market Data and additional important information.
[1] Please find the MSCI World Quality Index methodology here: https://www.msci.com/documents/10199/344aa133-d8fa-4a15-b091-20a8fd024b65
[2] The QUALITY score is calculated as an equal weight of the z-scores (i.e. the number of standard deviations from the mean a data point is. Z-scores may be positive or negative, with a positive value indicating the score is above the mean and a negative score indicating it is below the mean.) of each of the four sub-pillar scores, where each sub-pillar score is determined by z-scoring and equal weighting individual pillar factors.
[3] The model is updated monthly. Returns data for the indices is sourced from Bloomberg and is stated in USD. The benchmark used is MSCI World Index; a ‘Down’ market is when the benchmark posts negative returns, and conversely an ‘Up’ market is defined as positive returns from the benchmark.
Warning: Past performance is not a reliable guide to future performance, there can be no assurance that any future investments will achieve similar results. Investments may go down as well as up. Performance may be affected by changes in currency exchange rates.